Every now and then I read the blog posts by Matthew Yglesias at Slow Boring and Ruy Teixeira at the Liberal Patriot. Both have recently argued that the Democratic Party’s focus on increasing voter turnout isn’t necessarily a gold ticket to assured victory. This kind of aligns with my muddled sense of contemporary voter dynamics. When I think of active voters, I think of folks who are highly educated, have high incomes, and are connected to the social world. Such folks are increasingly in the Democratic Party, which suggests to me that the qualities it takes to be a non-voter are increasingly divergent from the qualities it takes to feel like a part of the Democratic Party.
The General Social Survey has repeatedly asked whether respondents voted in the previous presidential election. It’s a noisy measure that probably isn’t as clean as many of the political science datasets out there, but I figure that it’s probably good enough. I’m going to look at a few key characteristics of nonvoters. To me, it seems that one’s partisan ideology matters. If all nonvoters are Democrats, then Democratic efforts to shift them to voters is a sensible decision! I will also look at race and educational attainment, as these are two key pillars of contemporary partisan politics.
Let’s take a look at the change in the partisan composition of nonvoters between 1972 and 2016 (last available presidential wave).

Solid lines are proportion of voters (three solid lines should ~ add up to 100% in a particular year). Dashed lines are proportions of nonvoters (three dashed lines should ~ add up to 100% in a particular year)
Here’s the big thing that I notice. Beginning in about 1990, the nonvoter composition really shifted, with Independents increasing from 20% of nonvoters to over 30%. Republican nonvoters have just kind of fluctuated between 25% and 35% over this time period. The share of Democratic nonvoters has really declined over time, from about 60% of nonvoters to about 40%. Most of this decline happened by 2000.
What about partisan ideology?

About 45% of nonvoters are moderates. Liberal nonvoters has declined from about 30% of nonvoters in 1972 to about 25% in 2016. Not a ton of interesting action here. Perhaps what’s most interesting is that among voters, liberal ideology has been on the upswing for a decade among voters, but not among nonvoters.
So what if we thought of these in combination? We could look at folks who are EITHER Democrats OR Liberals (similarly EITHER Republicans OR Conservatives, EITHER Independents OR Moderates). I suppose this would represent potential red and blue reservoirs among the nonvoters (these obviously won’t add up to 100%, since a moderate could be in all three groups).

Yeesh…a massive drop of the potential blue reservoir of nonvoters. In 1972, 7 out of 10 nonvoters were EITHER Democrats OR Liberal. By 2016, that was just at 50%. Through 1990, such D/L’s were a larger share of nonvoters than voters. From 2010 onward, D/Ls are a larger share of voters than nonvoters.
What about race?
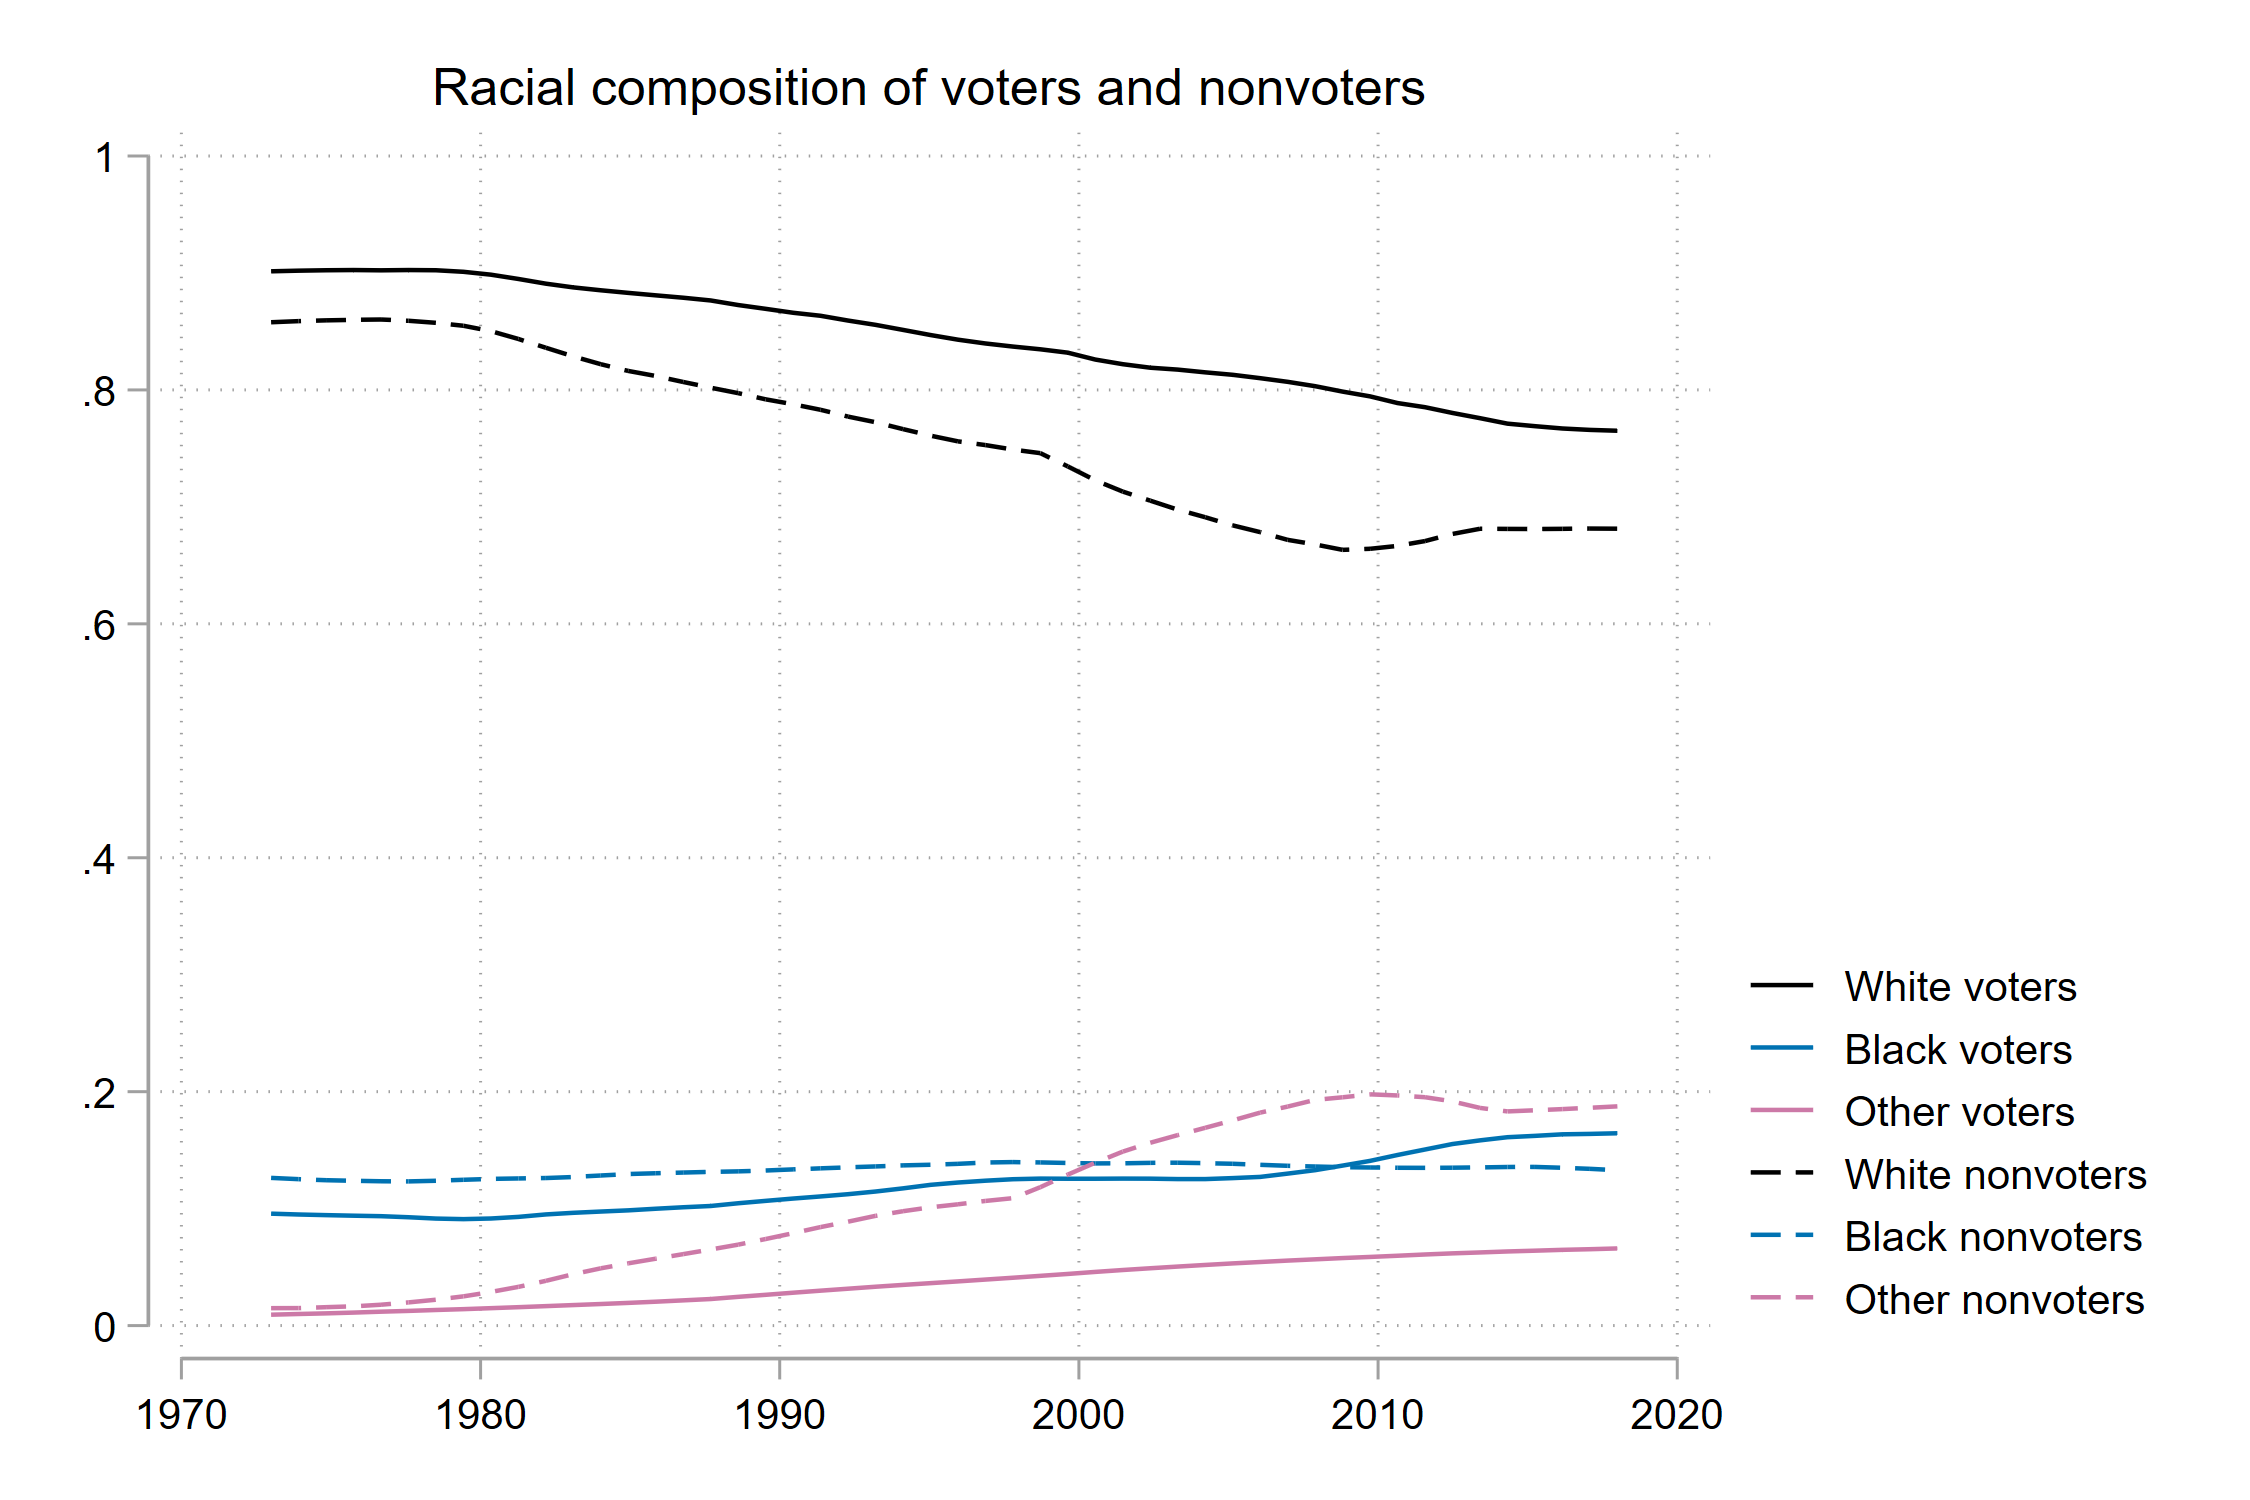
Weird and interesting. Unsurprisingly, we see the much larger share of white individuals among voter and nonvoters. We see that the nonvoter group is becoming more racially diverse than the voter group (e.g. a larger share of voters is white compared to the nonvoter group). BUT, it’s “other” racial groups that are increasing in the nonvoter population. Remarkably, from about 2010 onward, the percentage of black voters is larger than the percentage of black nonvoters (a pretty awesome accomplishment primarily, imo). But many folks have highlighted the problems Democrats are having with Hispanic/Latino and Asian voters, who most likely make up the large majority of the “other” category. So weirdly, the nonvoter population is becoming more racially diverse in a way that’s not obviously advantageous to Democrats.
Finally, let’s take a quick look at educational attainment, focusing on college / noncollege, perhaps the most significant social gap in the US today.
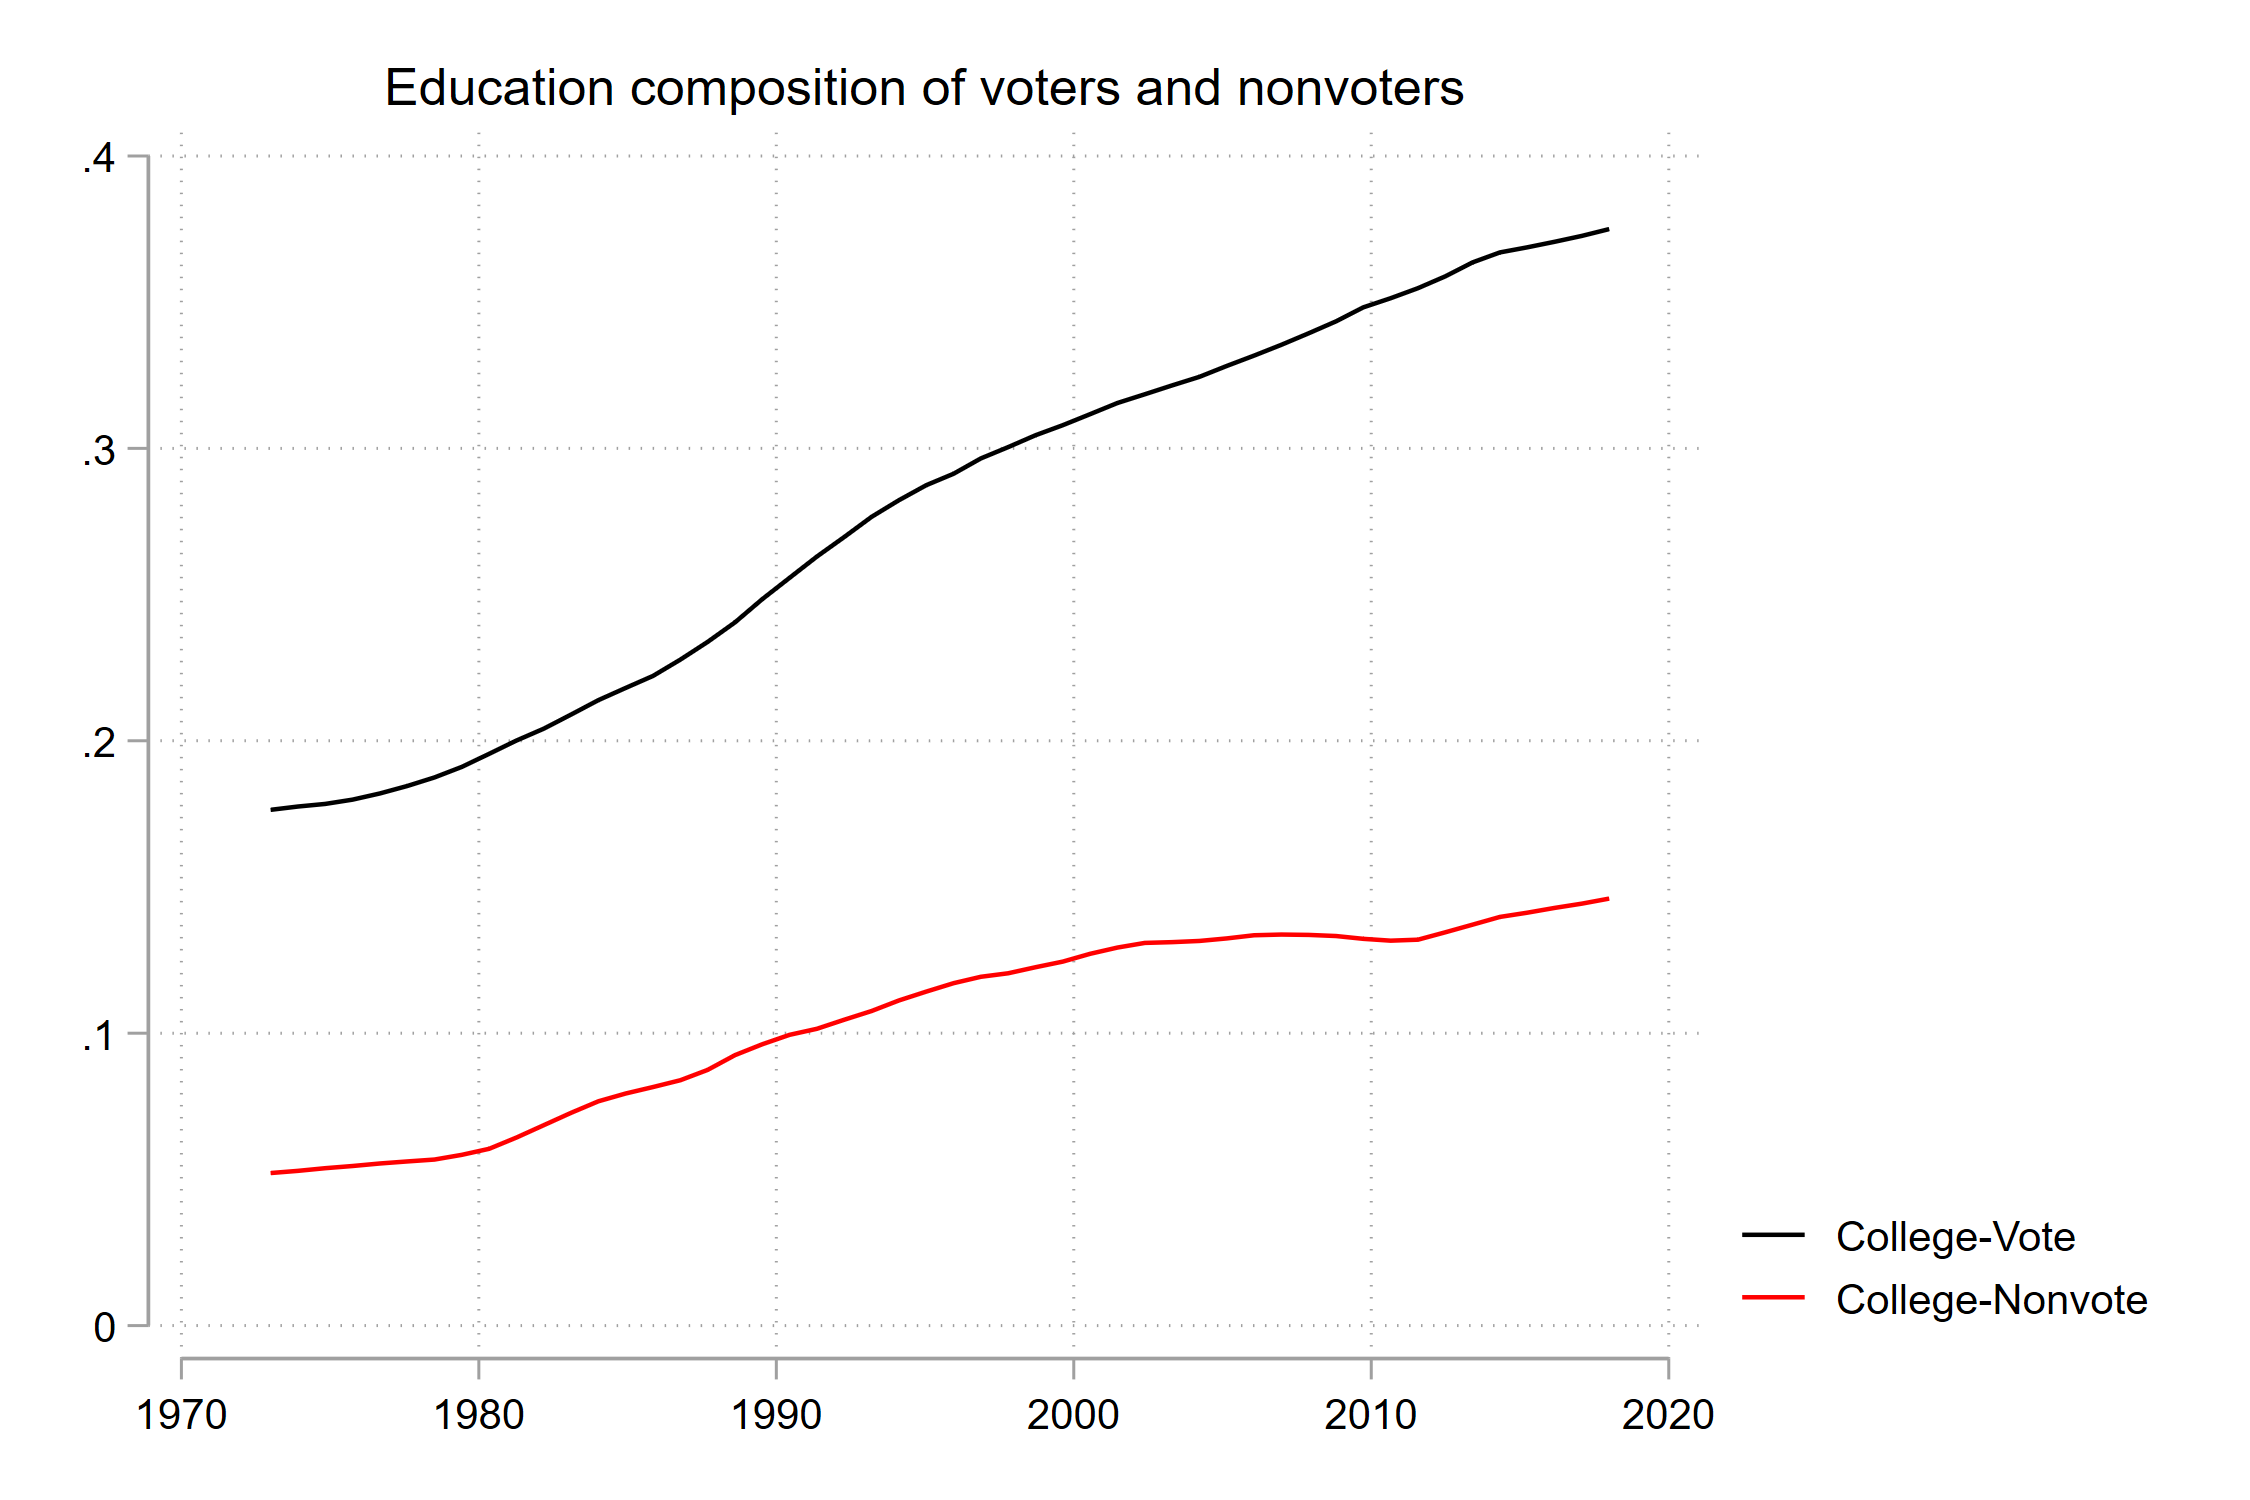
Hey look at that. Educational expansion. Both voter and nonvoter groups are growing in share of college educated people. But the share of college educated is growing much faster in the voter population, from about 20% to just under 40%, compared to nonvoter population, from about 5% to 15%. Put differently, the college gap across voter-nonvoter populations grew from 0.15 to 0.25. Given the Democratic alignment squarely with higher education, this suggests a growing gap between Democrats and nonvoters.
So overall, what’s happening to the relationship between Democrats and nonvoters?
In the early 1970s, the vast majority of nonvoters had some Democratic or Liberal characteristics. Today that’s not the case.
The nonvoter population is increasingly diverse. But that’s driven by categories other than White and Black, groups which the Democratic party may be struggling to rally.
Nonvoters are increasingly less educated compared to voters. This gap has become much, much more pronounced in the past half century.
I’m sure that political scientists have looked at this question with more elegance and sophistication. I’m also a big advocate of political participation. It would be really , really good if all Americans felt motivated to participate in mass politics. But I think that recent arguments about the shortcomings of mobilization arguments for Democrats are probably more correct than not.