I am not entirely innumerate. But I feel like I am when I hear discussions of economic amount like one billion dollars. It’s easy to forget how difficult it is to think exponentially. I find myself often thinking, “Yeah. A billion’s more than a million, blah blah blah” and then moving on with my life. But one billion is so, so much more than any amount of money most of us deal with or manage in our daily lives. Comprehending the magnitude of this gap is especially important when we discuss issues of justice and fairness of economic outcomes between folks (see my grumpy views a few posts ago). Below I’m going to show you how I remind myself of how much wealthier a billionaire is than a typical person.
The median household income in the United States is about $68,000. Let’s round that down to $50,000 to make our task simpler (if your alarm bells are going off because $18k sounds like an unreasonably large rounding difference…keep reading…).
The median household wealth in the United States is around $100,000. Let’s be generous and round this up to $150,000, just to make sure we’re not being unfair in our comparisons (if you think that bumping $50,000 into a person’s wealth sounds like a massive decision that might bias our comparisons…keep reading…).
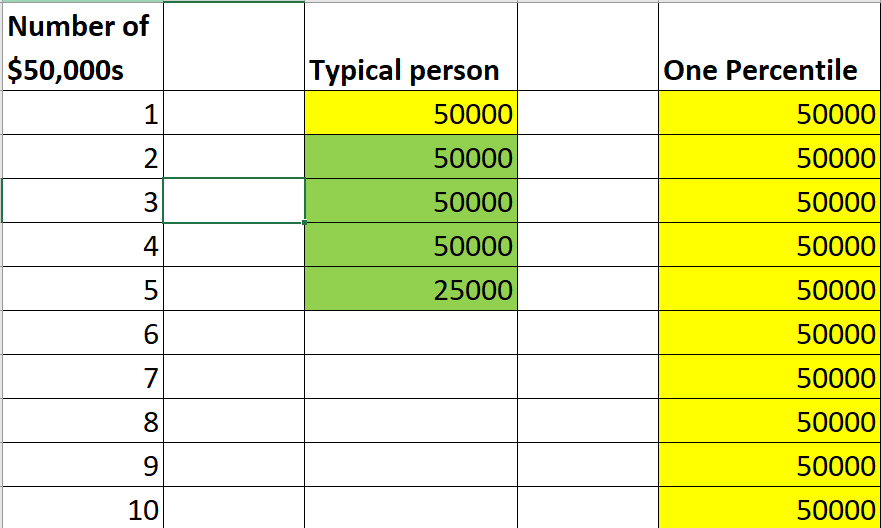
Let’s make an Excel spreadsheet to indicate these levels of income and wealth for our median person. Let’s have each cell in our spreadsheet be equivalent to $50,000, or roughly the median household income.

Here is, roughly, our median person. Each cell in the spreadsheet is $50,000. The yellow cell is their annual income, and the green cells are their levels of wealth. I threw a half cell at the end of $25,000 to account for rounding problems. And remember, I threw this median person another $50,000 of wealth, assuming that our numbers are a tad out of date and perhaps the recent bump in housing values and stock prices assisted the typical person slightly. That means this stack is fudged a bit, but this is generally where the typical household is at. Nearly 5 cells down.
How about a very rich household, like at the 99th percentile? Well, this household makes about $500,000 a year. And the 99th percentile of wealth is about $11,000,000. (it actually looks to be around 10.4 million a few years ago. I’m assuming the top 1% cutoff has grown by ~ 600k to make round numbers easier to work with. If you think a $600,000 rounding difference is massively too much and will bias our comparisons…keep reading…). That’s a lot! What decadence, right!? Let’s visualize this fictitious person in our spreadsheet.
Lots of annual income, easily surpassing the total income / wealth of the median household.

You can see that each year the 99th percentile pulls in over 2X the total money of the median household. We then move onto visualizing 11 million dollars compared to our rough set of 5 cells for the median person, or compared to the median person’s $225,000 of cells.

Wow! That's a big difference! Keep in mind, each cell is approximately the annual income of the median household. Where does this 99th percentile person’s spreadsheet row end?

The median household ALMOST got to cell 5, but not quite. The 99th percentile got to cell 230 (or…they’d get to cell 218 if you are still grumpy about my wealth rounding decision). That’s a pretty big difference! Keep in mind, each cell is roughly the amount of money earned each year by the typical household.
What about the billionaire? We’ve only compared the 50th and 99th percentile thus far. We’re only thinking about a measly 11 million. Let’s add a person with one billion dollars in wealth and nothing else.

THIS IS ONLY THE BEGINNING!!! It doesn’t fit on my screen!! Excel cannot zoom out sufficiently far enough to show one billion.
Let’s see the cell where it ends.

TWENTY THOUSAND!!!! The gap between the 50th percentile and 11 million is about 225 cells. The gap between one billion and the 99th percentile is TWENTY THOUSAND MINUS 230, WHICH IS FOR ALL INTENTS AND PURPOSES TWENTY THOUSAND!!!
I visualized the difference by printing all cells into a pdf. Each page is about 50 cells or so. It’s in the link below.
The median household got to the top of page 1 of the pdf.
The 99th percentile, someone earning a half million dollars and holding 11 million dollars, got just to the bottom of page 5 of the pdf.
Before clicking on the link: given the information I’ve presented about the 50th and 99th percentiles, how many pages do we need to fit the billionaire into the pdf?
…
…
…
…
…
…
426 pages!!!!!!!!!
That is NUTS! And to be on spot 139 of the Forbes billionaire list, you need to have 10 billion dollars. That is…4,260 pages of excel cells. The median is 5 cells at the top of page 1. The 99th percentile person stops on page 5.
The 139th richest person is THREE AND A HALF COPIES OF WAR AND PEACE SITTING ON TOP OF EACH OTHER.
This is one basic reason why people are not totally sure that our current distribution of economic rewards is totally just.
But I think this is also why billionaires are in a great social psychological position. The sheer magnitude of the difference of economic returns is very, very difficult to comprehend.