The last sixty years have had some consequential and odd shifts in labor force participation, or those who are not in the labor force (NILF). The difference between unemployment and NILF: you are unemployed if you are actively looking for employment. You are NILF if you do not have a job, operate a farm/business, work for pay, and you are not looking for work. I’ve seen this arise primarily in discussions on the rise of NILF men, with primary focus on the role of opiates and video games as potential drivers.
The trends below are from the US Census and American Community Survey. I’m looking at prime-aged folks, between 25 and 54. This restriction lets us not be too worried about things like educational attainment and retirement driving results. Don’t hang your hat on 2000-2008 data, because there’s some oddities in the Census these years. I left them in the first few graphs but didn’t use them to connect the trend line.
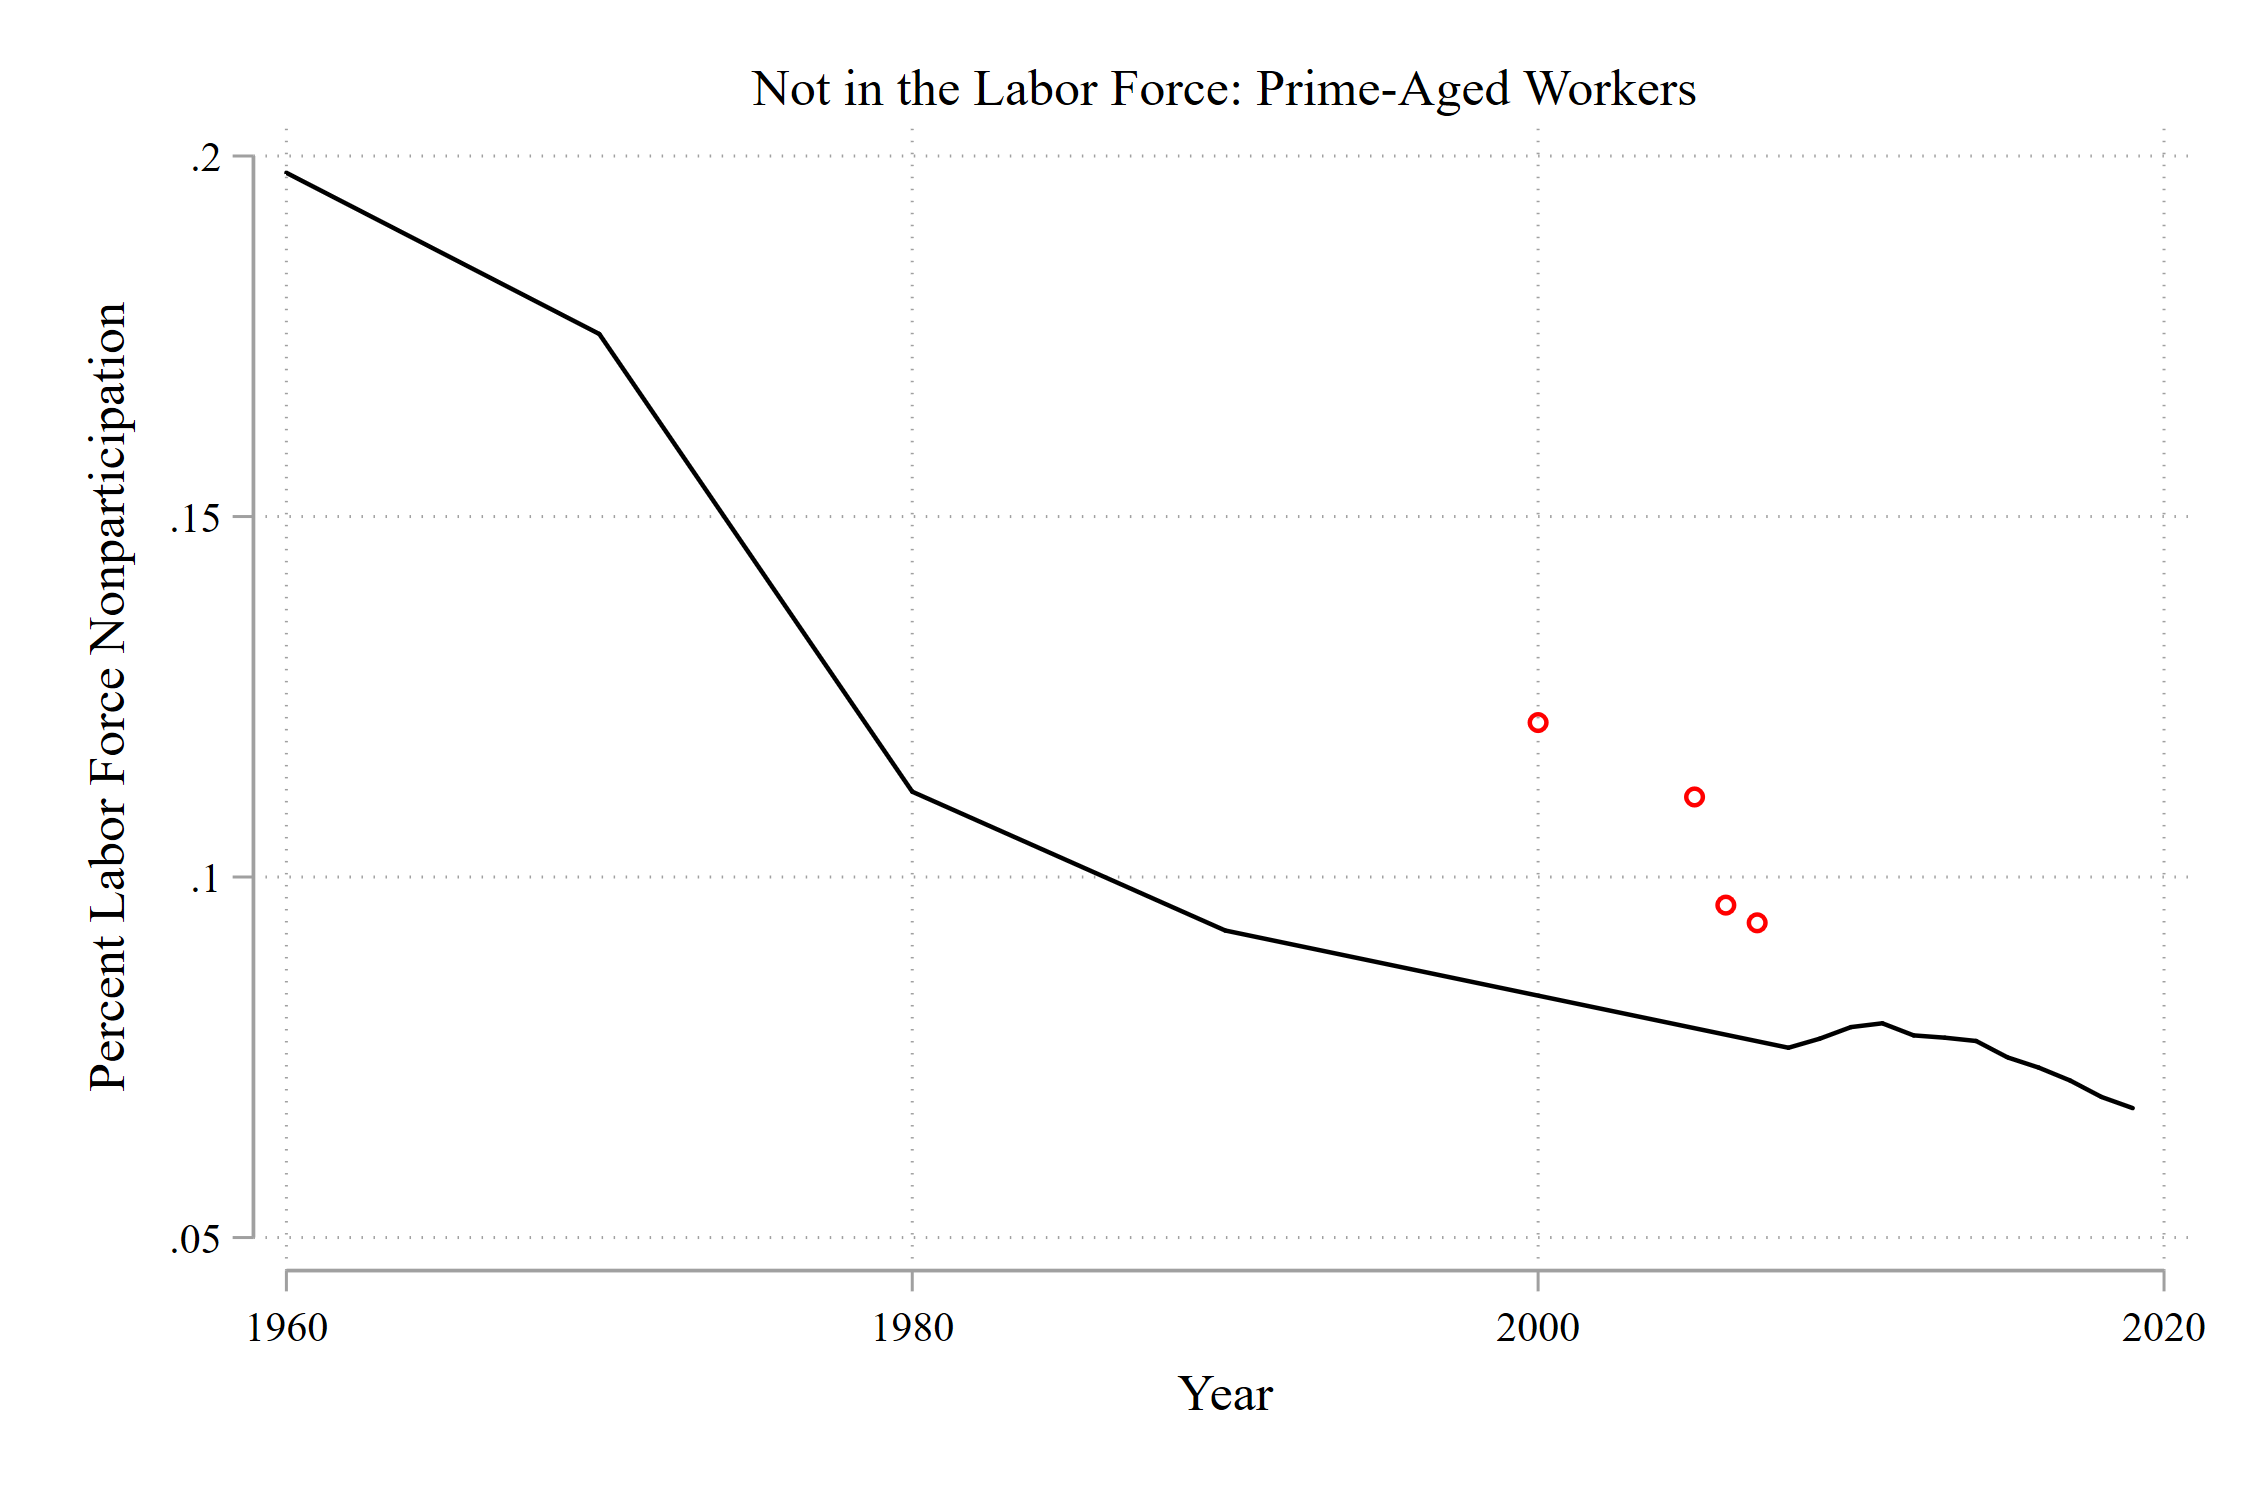
A massive decline between 1960 and today of labor force nonparticipation, from about 20% of prime-aged workers in 1960 to about 7% in 2019.
Obviously, gender is one of the main drivers of these trends. Women entered the labor market during this period in revolutionary numbers.

Whoa. A decline from 40% NILF among women in 1960 to about 10% today. The latter half of the 20th century was, indeed, revolutionary. I see maybe a slight increase among men but nothing I’d write home about.
Which women are driving this trend? As you’ll see, education is a clear marker of NILF status. Results below are gender-by-education trends.

You see the group with the lowest nonparticipation is college-educated men. Then, college-educated women and men with a high school degree or less have converged to essentially the same levels by the 2010s. High school educated women have the highest rates of labor force nonparticipation. The fates of women with different education levels began to diverge in 1980.
I like these trends because they’re kind of like that optical illusion where the rabbit can be a duck. Lots of attention has been placed on less-educated men’s growing nonparticipation. It’s growing to the level of highly educated women! Puts things into perspective. Women, especially women with a college degree, have made great strides in the labor market. Their labor force nonparticipation has declined to levels of less-educated men!
Overall, labor force participation has declined among prime-aged workers. How has the composition of this group shifted over time?
I look at the total NILF group and split it into six groups: men and women by three education categories: high school or less, a college degree or more, and in between. First, let’s just look at the change in the composition over time.
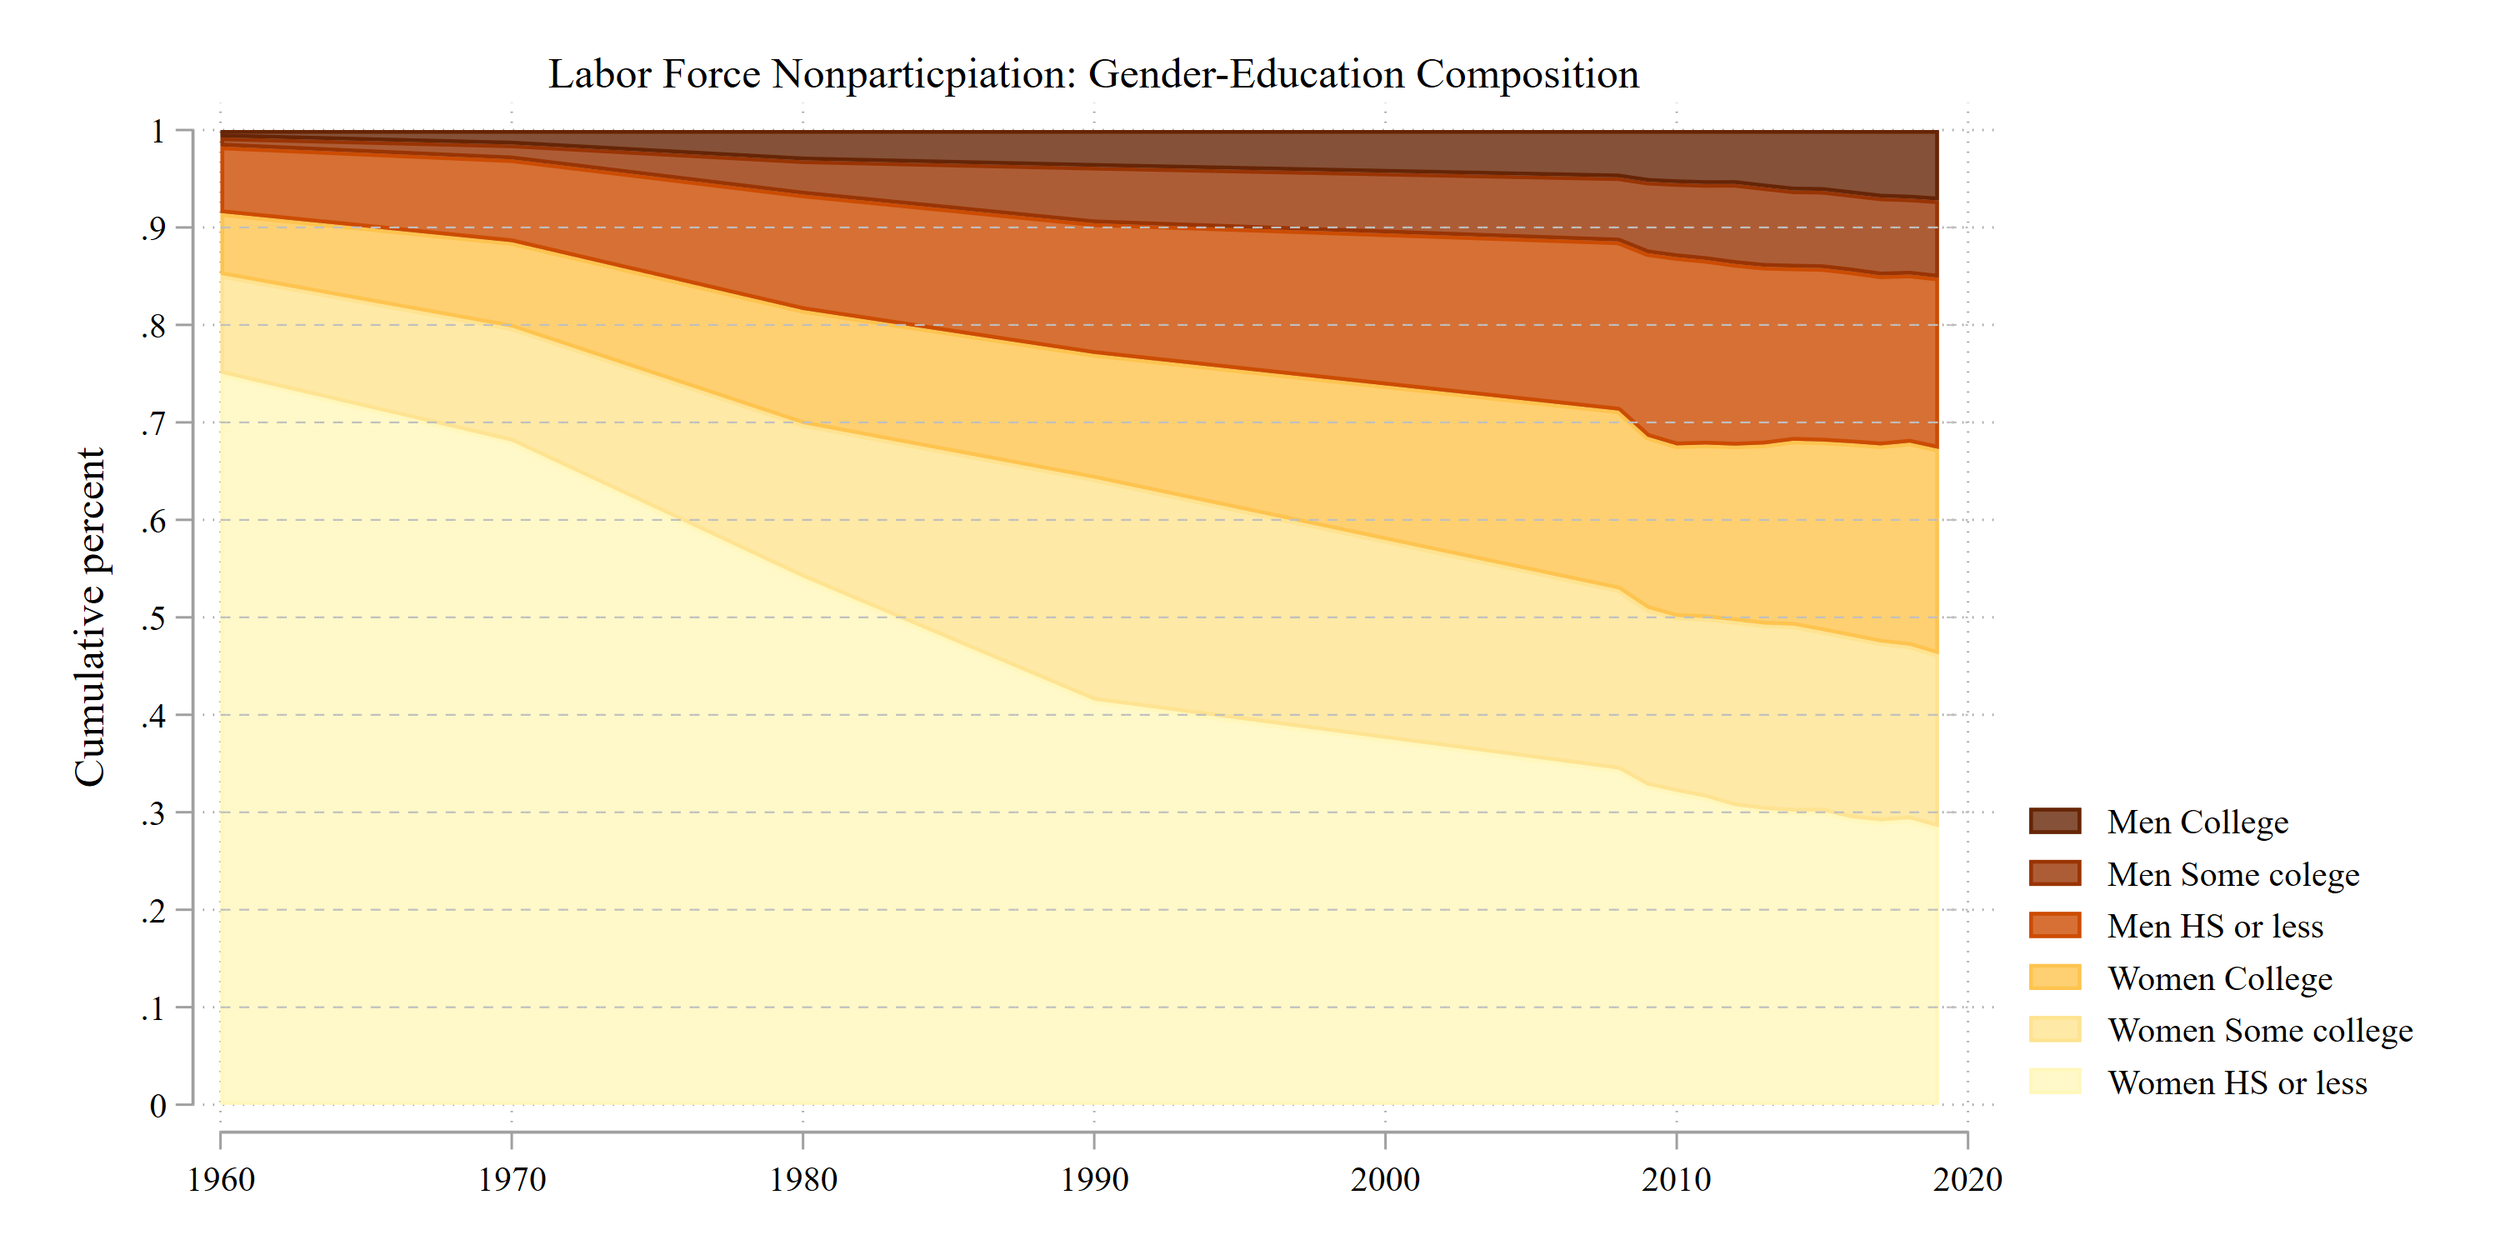
A revolution in compositional change. In 1960, almost 8 out of 10 folks 25-54 not in the labor market were lower educated women. Today that number is 3 out of 10. Labor force nonparticpation declined from 90% female to 70% female over time. NILF women have increased in their educational attainment. At the same time, men’s share grew from less than 10% to a tad over 30%. This growth was most driven by those with a high school degree or less.
Another way to look at these trends is to force the composition to the overall percent of folks not in the labor force.

It’s a little trickier to see the changing composition here. The big points, which seem to be the most important, are [1] women’s educational attainment has dramatically increased during this time, meaning fewer women with lower education levels and [2] more women entering the labor market, thus women make up a smaller share of labor force nonparticipation.
I don’t have much insight or wisdom to cap things off. I find these trends pretty interesting. I hope you do too!